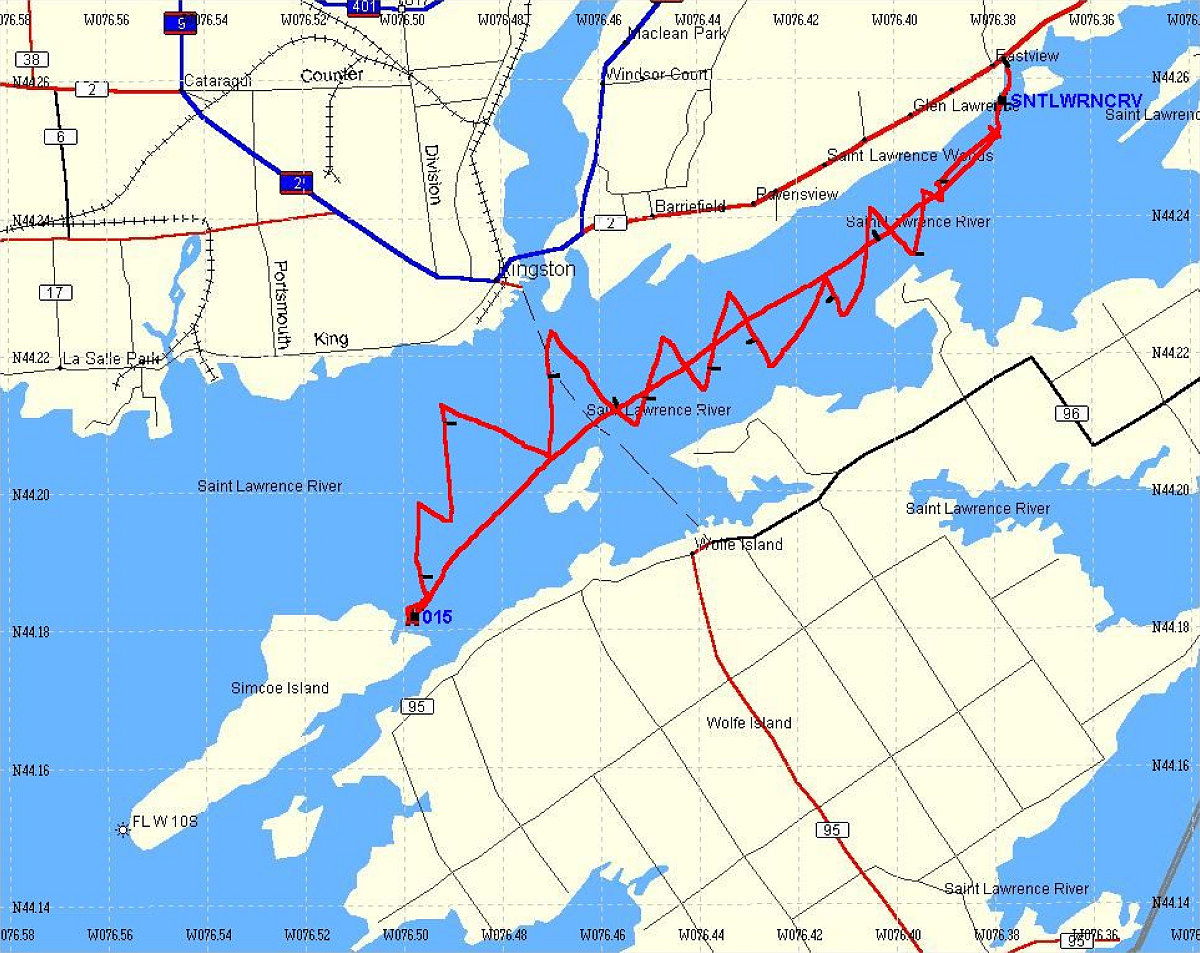
This is a map of the general area of our sail. The red is a GPS-derived tracklog of our route. You can see how we had to tack our way southwest. On the way back, you can see how we basically had the wind going pretty much in our direction of travel, so the trip back was direct and fast. Here are some salient points about our journey:
Day 1: start time 1:30 pm, end time 6:30 pm (total time: five hours). Total distance covered: 24.84 km, at an average speed of 5.0 km/hr.
Day 2: start time 8:40 pm, end time 10:15 pm (total time: 1 hour 35 minutes). Total distance covered: 13.88 km, at an average speed of 9.1 km/hr.
This image is from the presentation "Sailing with Roland".
 Go to presentation where this image occurs.
Go to location in presentation where this image occurs.
Go to presentation where this image occurs.
Go to location in presentation where this image occurs.
Copyright 2001-2016 alavigne.net.