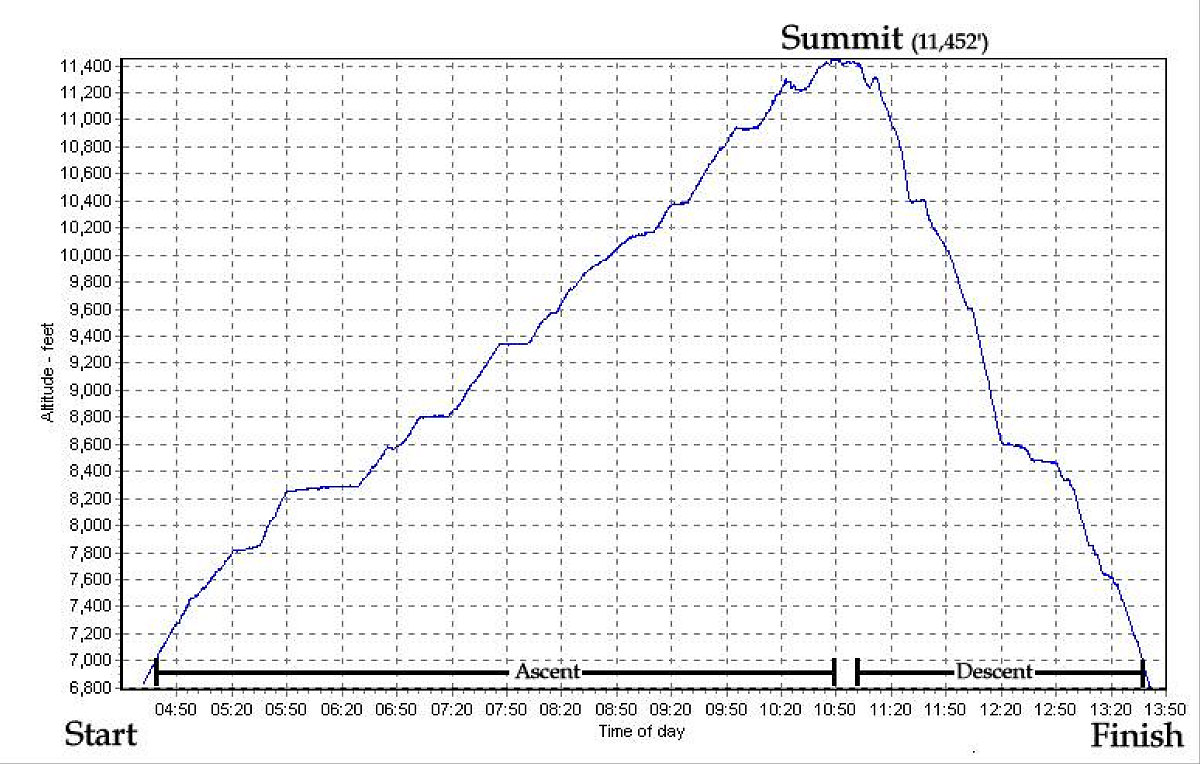
This graph shows our height progress over time, from start to summit and back again. Most of the flat spots indicate rest breaks. Note how much faster we came down (almost exactly 2x faster).
This image is from the presentation "Rockies Mountaineering - Mt Athabasca - Yamnuska Snow + Ice Long Weekend - Maps and Graphs".
 Go to presentation where this image occurs.
Go to location in presentation where this image occurs.
Go to presentation where this image occurs.
Go to location in presentation where this image occurs.
Copyright 2001-2016 alavigne.net.