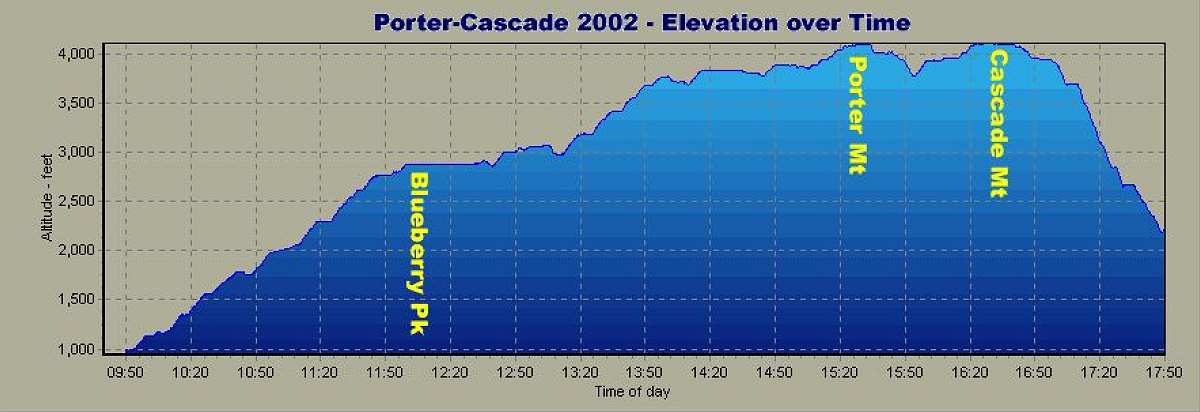
This graph shows our elevation progress over time through the day. Any obviously flat spot most likely represents a rest break.
This image is from the presentation "Porter Cascade 2002".
 Go to presentation where this image occurs.
Go to location in presentation where this image occurs.
Go to presentation where this image occurs.
Go to location in presentation where this image occurs.
Copyright 2001-2016 alavigne.net.