This graph shows the elevation profile of the hike. Start is on the left, finish is on the right.
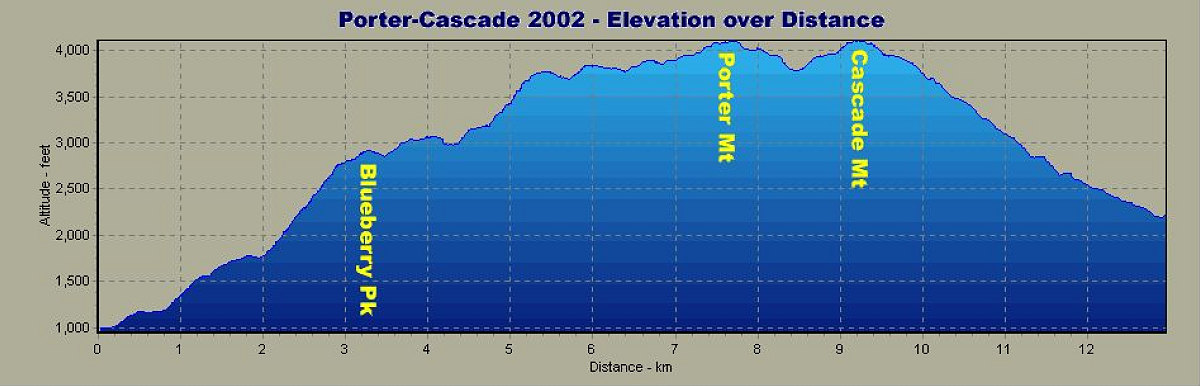
This image is from the presentation "Porter Cascade 2002".
 Go to presentation where this image occurs.
Go to location in presentation where this image occurs.
Go to presentation where this image occurs.
Go to location in presentation where this image occurs.
Copyright 2001-2016 alavigne.net.